

The US stock market as represented by the S&P 500 index closed at another all-time high on Friday.
- The bull market in global stocks since 2009 has been led by US equities.
- The bull market in US equities has been led by Technology stocks.
It’s an old stock-market adage that you should carefully watch the leaders in a bull market because when they start to tire it can be an early warning sign.
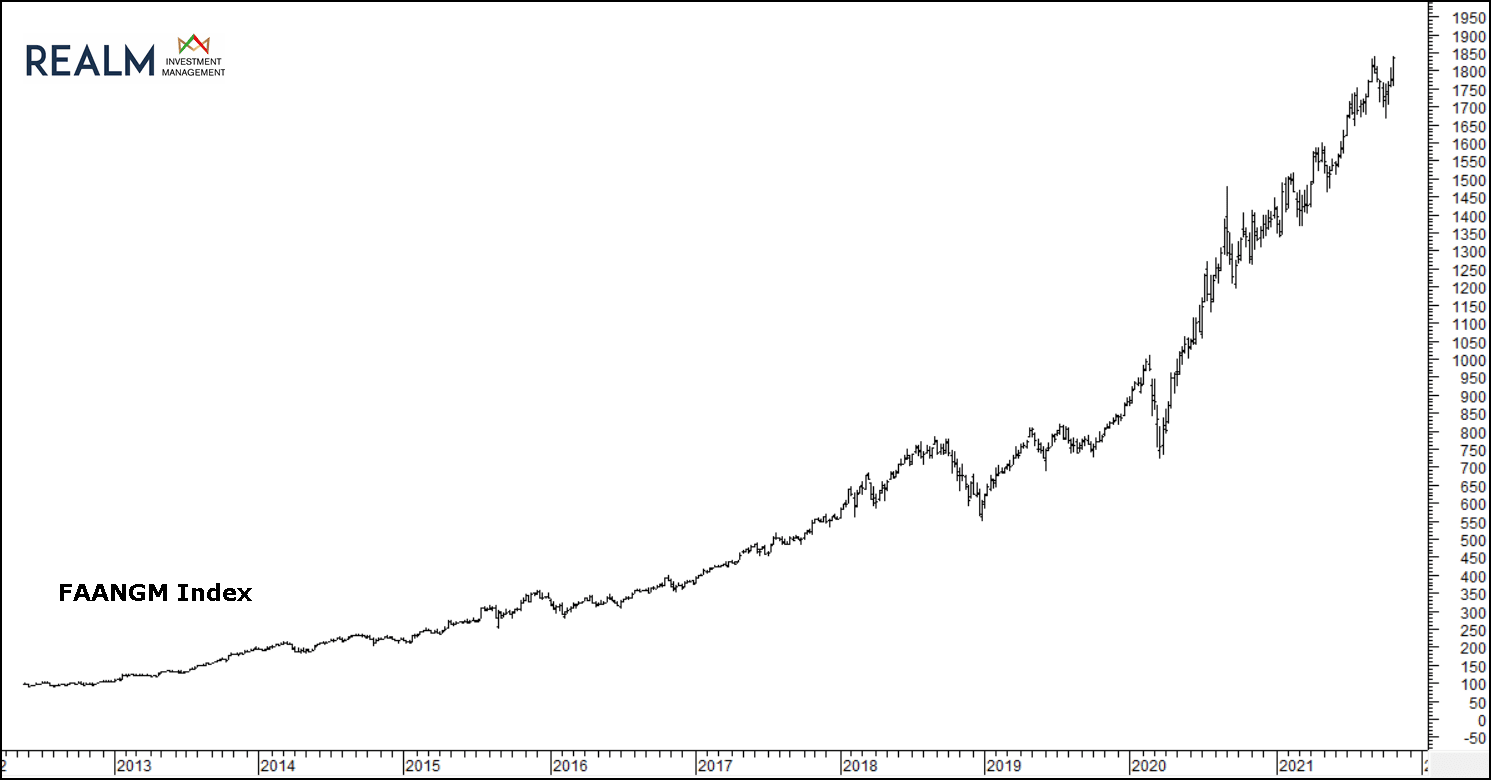
As you probably know, the so-called FAANG stocks are the US technology giants, Facebook, Amazon, Apple, Netflix, Google (Alphabet). The original acronym was later extended to FAANGM to include Microsoft. If one is looking for global leaders of the bull market they are right here.
We created an index of these six stocks – the FAANGM index. It looks like this:
In the next chart we have re-based the FAANGM index to start at a value of 100 in 2012, and by doing the same with the S&P 500 index we can easily compare the performance of the two.
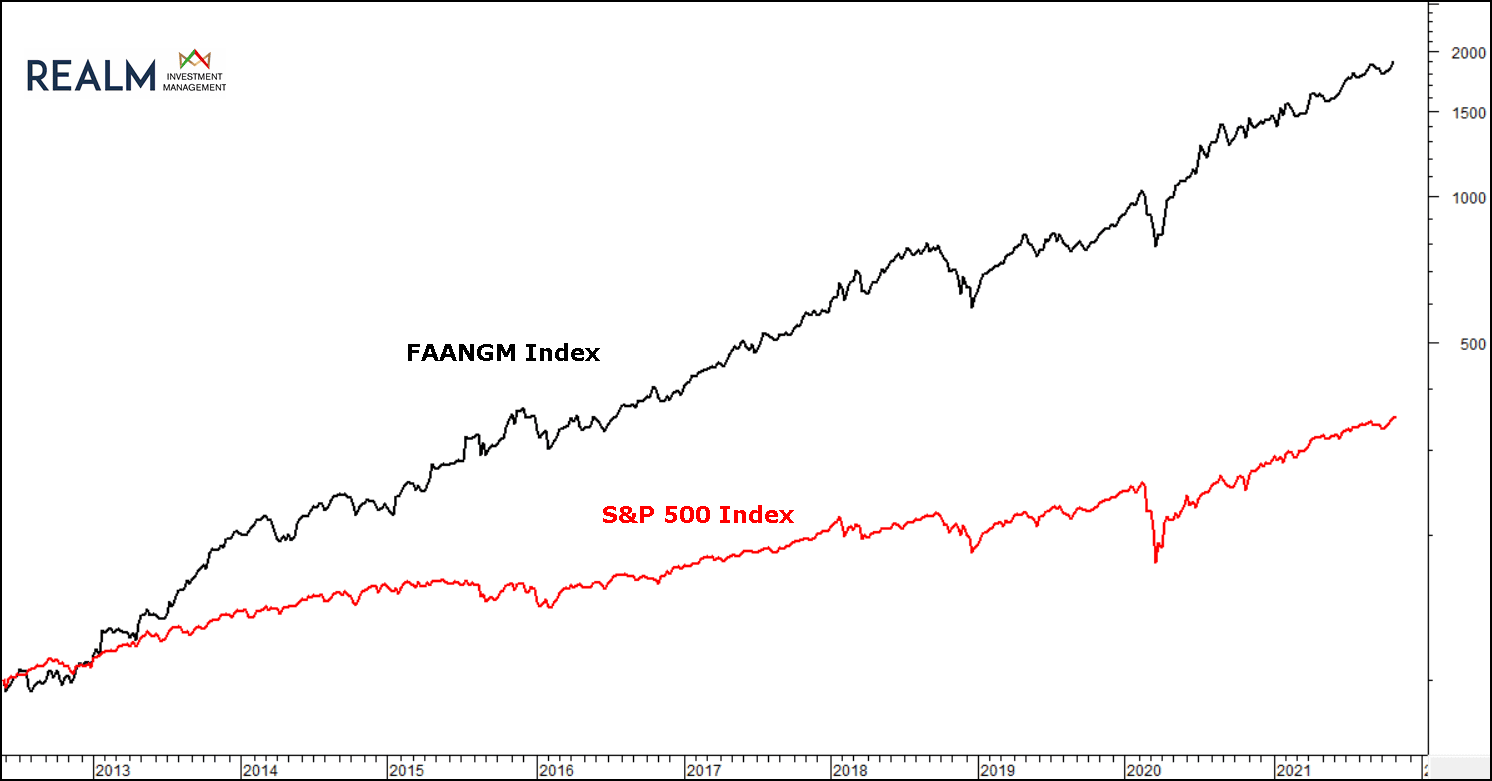
The S&P 500 has had a tremendous run but its lagging performance compared to the FAANGM index is immediately apparent. Why is this important?
The S&P 500 is the most closely followed equity index in the world, often used as a proxy for “the market”. It represents 80% of the market value of US stocks. It is also market-cap weighted, meaning each stock within it has an influence on the overall index commensurate to its individual market capitalisation. For example, Apple has an influence on the S&P 500 of 6.2%, the largest of any stock.
Here’s the important bit: the influence of the FAANGM stocks in total is approximately 24%. That’s right, six stocks out of the 500 (approx.) in the index have a 24% sway on the index itself.
What’s the point here? The point is that everyone’s happy while the Big Tech stocks are soaring, leading the S&P 500 (the market) higher and lifting sentiment, but what happens when (for whatever reason) Big Tech falls out of favour and large, institutional investors start to lower allocations? Of course, nobody knows the answer to that question for sure, but technology has had an incredible ride these last few years and a chart of any individual FAANGM stock could be seen as over-bought with the potential for a large, sharp fall at any time. And remember, any negative outcome could be exacerbated if selling initiates more selling by managers of index ETFs, trackers and large-cap mutual funds.
There’s no point in trying to guess when or if this might happen, and remember if Tech does turn lower it could be from a much higher starting point, but we do offer one more chart below that we will be watching closely going forward and in our opinion is a candidate right now for “The Most Important Chart in the World!”.
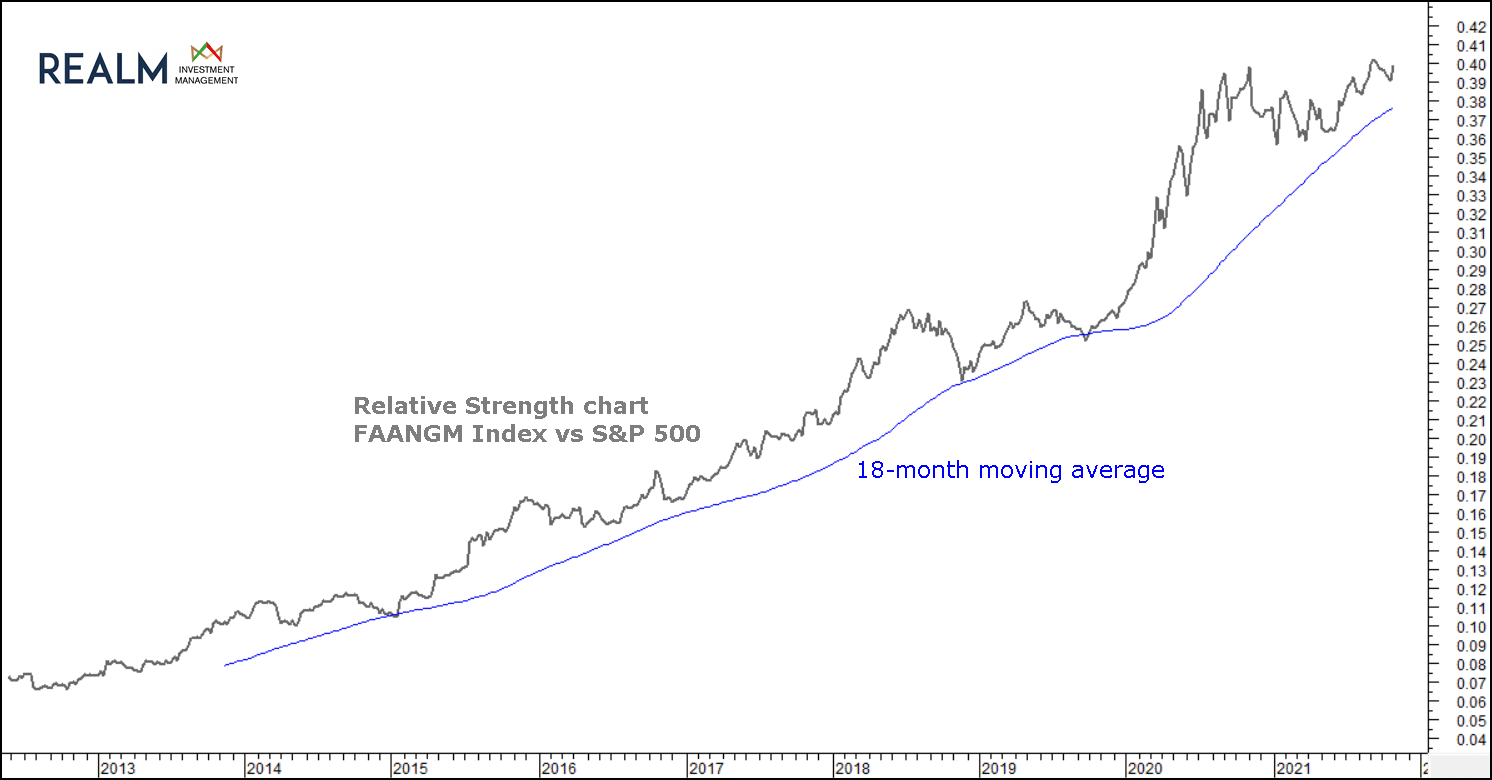
This is a Relative Strength chart. It shows the performance of the FAANGM index relative to the S&P 500. Its upward trending nature over the last few years tells its own story. This is a weekly chart and importantly we have added an 18-month (actually 78-week) moving average.
The chart has bounced three times from its moving average in the last few years, in 2015, 2018 and 2019. We would suggest that if / when the chart breaks convincingly below the average line the long-term trend may well have changed and it may be a good time for investors to review their risk exposure. As already said – we will be watching closely.
Disclaimer: ‘Where the business has expressed opinions, they are based on current market conditions, they may differ from those of other investment professionals and are subject to change without notice. The information contained within this communication is believed to be reliable but Realm Investment Management Limited does not warrant its completeness or accuracy. This communication is not intended as a recommendation to invest in any particular asset class, security or strategy. Regulatory requirements that require impartiality of investment/investment strategy recommendations are therefore not applicable nor are any prohibitions to trade before publication. The information provided is for illustrative purposes only, it should not be relied upon as recommendations to buy or sell investments.’